Why is the weather forecast sometimes wrong?
A modern five-day forecast is as good as a three-day forecast was in the 1990s. It still misses. Here is where the misses come from, and which ones you can plan around.
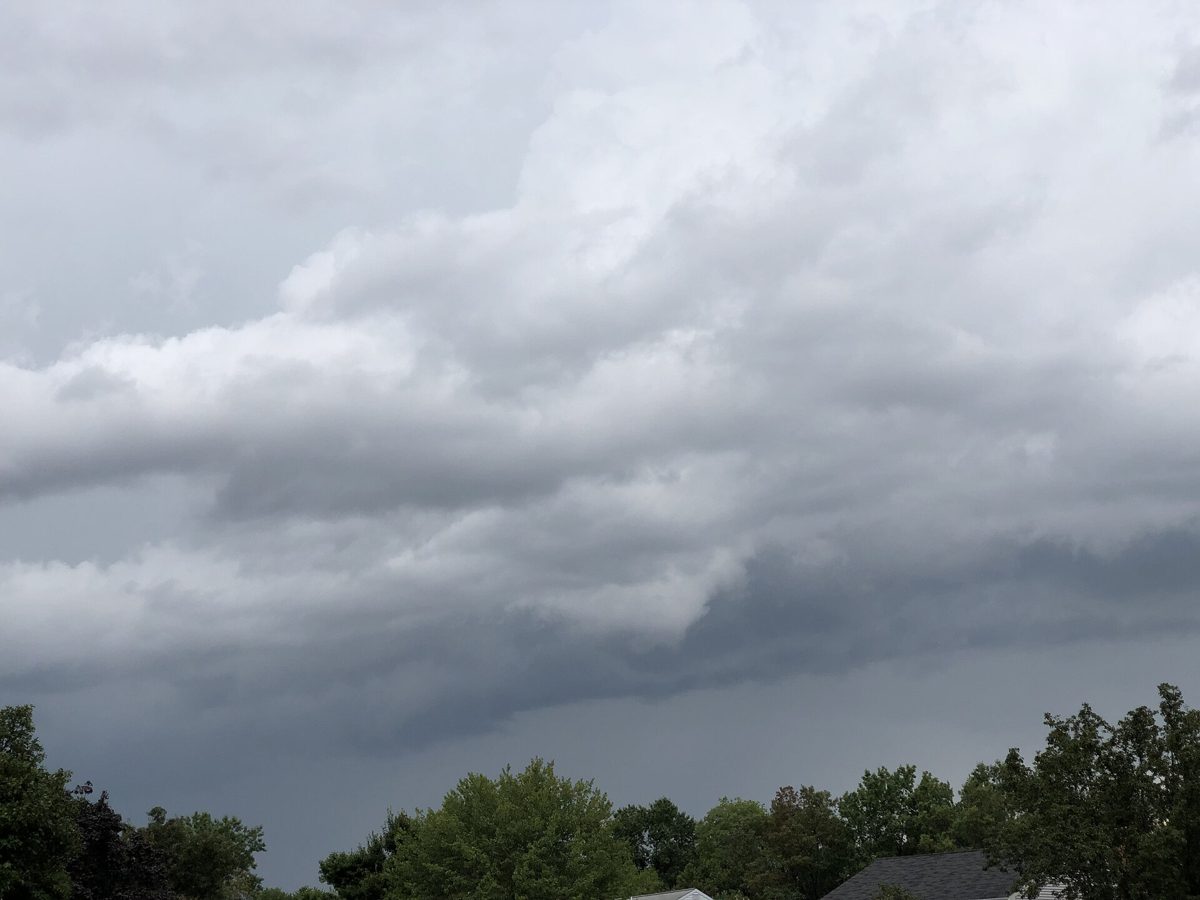
A weather forecast is not a prediction in the everyday sense. It is the output of a physics simulation that starts from an incomplete picture of the atmosphere and runs forward in steps of a few seconds, on a grid of boxes roughly 9 to 13 km wide. Every forecast error traces back to one of five places in that chain. Knowing which one bit you tells you how much to trust the next forecast, and that is exactly what we measure city by city.
1. The atmosphere is chaotic, so small errors grow
In 1963 Edward Lorenz showed that a simplified weather model gave completely different results when he restarted it from numbers rounded to three decimal places instead of six. That sensitivity is a property of the atmosphere itself, not of the computers. Two forecasts that start almost identically drift apart, and after roughly ten days the differences are as large as the weather itself. This is why no forecast service is much use beyond day ten, however good its model: the growth of tiny initial errors sets a hard ceiling.
Forecasters handle this by running the model 30 to 50 times with slightly different starting points, an ensemble. When the members agree, the forecast is confident; when they fan out, it is not. Our model comparison is a cheap version of the same idea: five independent models for the same hour, and a flag where they disagree.
2. The starting picture has holes in it
A model can only be as good as its knowledge of the atmosphere at the moment it starts. Over Europe and North America that knowledge is dense: radiosondes, aircraft, radar, surface stations, satellites. Over the oceans and the southern hemisphere it is thin, and the atmosphere over the Pacific today becomes the weather over the Pacific coast in three days. Satellites have closed much of this gap since the 2000s, which is the main reason forecast skill has improved by about one day per decade: today's day-five forecast is about as accurate as a day-three forecast was in the mid-1990s, as the review by Bauer, Thorpe and Brunet in Nature documented.
3. Showers are smaller than the model's boxes
The global models that most apps rely on divide the atmosphere into grid boxes roughly 9 km (ECMWF) to 13 km (GFS) across. A summer shower is one or two kilometres wide. The model cannot see individual showers; it estimates how much shower activity a box should contain, a process called parameterisation. That is why a forecast can say "40 % chance of rain" and be correct while your street stays dry, and why the exact hour of a shower is the least reliable number in any forecast. National high-resolution models with 1 to 2 km boxes do better for the next day or two, but they cannot run out to a week.
4. Timing drifts before the weather does
Most "wrong" forecasts are right about the weather and wrong about the clock. A front that was due at 14:00 arrives at 17:00; the rain still came. A model's timing error grows with lead time, roughly an hour or two per day ahead. If the timing matters, a cold front before a wedding for instance, check the forecast again the morning of, and compare models rather than trusting one. Where they place the front within an hour of each other, timing is settled; where they are three hours apart, it is not.
5. The forecast was read as a promise
Icons compress a probability distribution into a single picture. A sun icon with "20 % rain" will be wet one day in five, and on that day the forecast was not wrong: it told you the odds. We wrote about what a chance of rain actually means. The same goes for temperature: a forecast of 22° is typically accurate to within about a degree the next day and two to three degrees at day five, so 24° on a day forecast at 22° is inside the normal error, not a failure.
Which model is wrong least? We measure it
None of this tells you which forecast to trust for your town, so we score them. Every day we compare what each model forecast for the day ahead against what actually happened, graded against ERA5 reanalysis, for hundreds of cities in each of the US, UK, Canada, Australia and New Zealand (1,880 in the UK alone). In the UK scoring window from 7 August to 6 September 2026, the European model scored 91 out of 100, the Met Office model 85 and the American model 81, with the gap widest on rain, where the European model's hit rate was 93 % against 84 % for the American model. The rankings differ by country and by city, which is the point: see which forecast is most accurate in the UK, or pick your own city from the city list.
What to do with a forecast you cannot fully trust
- Read the chance, not the icon. 30 % means dry more often than not, but pack accordingly.
- Trust temperature more than rain timing. Temperature errors are small; shower timing errors are large.
- Compare models. Agreement is a stronger signal than any single model's confidence.
- Re-check the morning of. A same-day forecast has a fraction of the error of a five-day one.
- Use the radar for the next two hours. Radar shows what is happening; models estimate what might.